Unleashing the Power of Data: Connecting Power BI Desktop to KQL Database in Fabric
In today's organizations, data serves as the vital force driving decision-making processes. As data environments become more intricate, the capability to promptly link, scrutinize, and present information visually becomes essential. The fusion of Microsoft's Power BI Desktop and the querying capabilities of KQL databases within Microsoft Fabric forms an unmatched pair for data specialists. This blog post will lead you through the complexities of setting up this connection and harnessing its potential for insightful data visualizations.
Introduction
Power BI, developed by Microsoft, is its premier tool for analytics and data visualization, whereas KQL (Kusto Query Language) is the robust querying language employed for examining extensive datasets in Microsoft's Azure Data Explorer and other services. MS Fabric, frequently considered as the internal 'backbone' of Microsoft's services, houses KQL databases that play a crucial role in the company's data infrastructure. By linking Power BI Desktop to a KQL database within MS Fabric, not only are the analytical capacities enhanced, but it also allows for effortless access to real-time data insights.
Prerequisites
Before we dive into the connection process, ensure you have the following:
Power BI Desktop installed on your computer.
Proper access rights and permissions to the KQL database within Microsoft Fabric.
Microsoft Fabric credentials for authentication.
Let's begin the journey to connect Power BI Desktop to a KQL database in MS Fabric.
Establishing a Connection to a KQL Database in MS Fabric
Step 1: Install Power BI Desktop
If you haven't already, you'll need to install Power BI Desktop on your machine. It’s available for free from the Microsoft Store or the Power BI website. Follow the installation instructions, and once installed, launch the application.
Step 2: Access Microsoft Fabric
Input the following URL into your preferred web browser: "https://app.fabric.microsoft.com". Proceed to enter your login details. After successful authentication, select the Data Engineering Persona within Fabric. Subsequently, access the workspace where you have previously established the KQL Database.
Step 3: Open Power BI Desktop
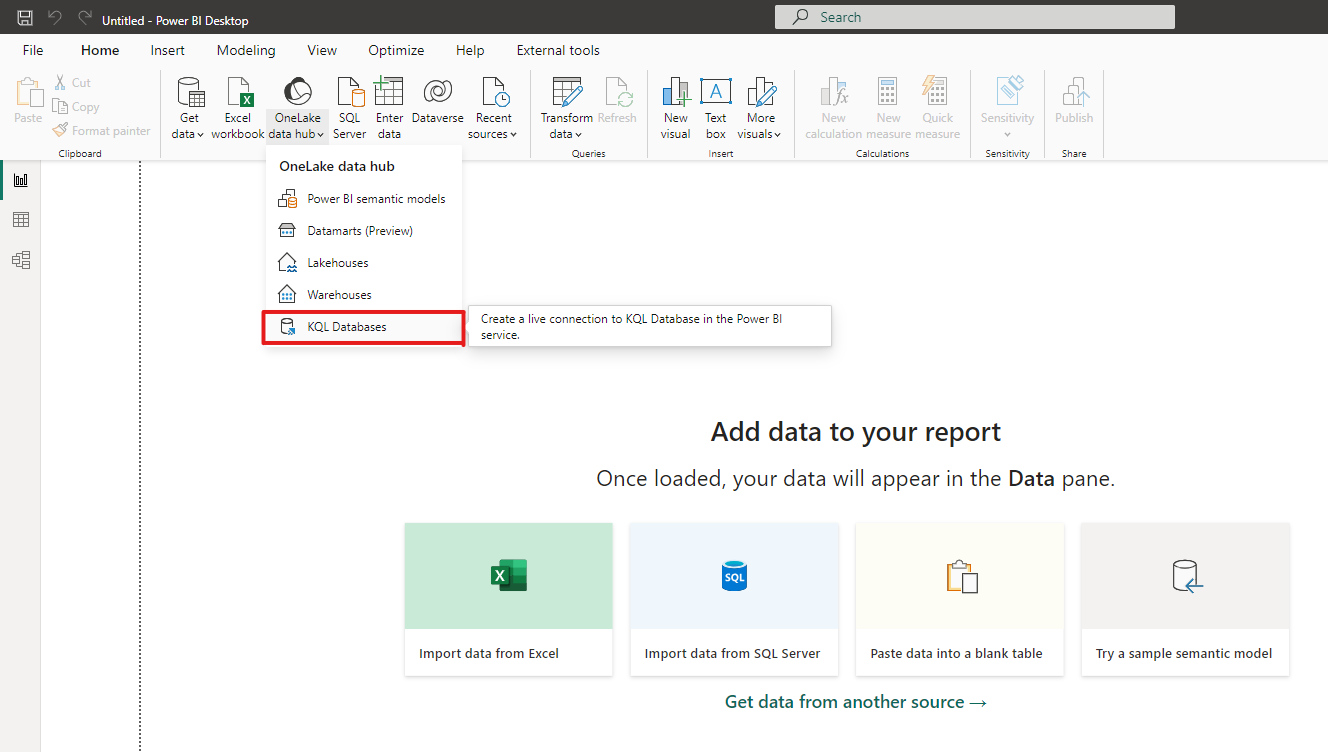
Navigate to the "Home" tab and select "OneLake Data Hub”. Choose "KQL Database".
Step 4: Choose the KQL Database
Upon successful connection, the OneLake data hub will present a list of accessible KQL Databases. Select the KQL Database that you prefer from the given options.
Then click on Connect.
Step 5: Select the Database and Table
Within the navigator pane, pick the preferred database and tables. Subsequently, you can either click on "Load" to import the data directly or select "Transform Data" to perform any required data modifications.
In this case we are going to click on “Transform Data”
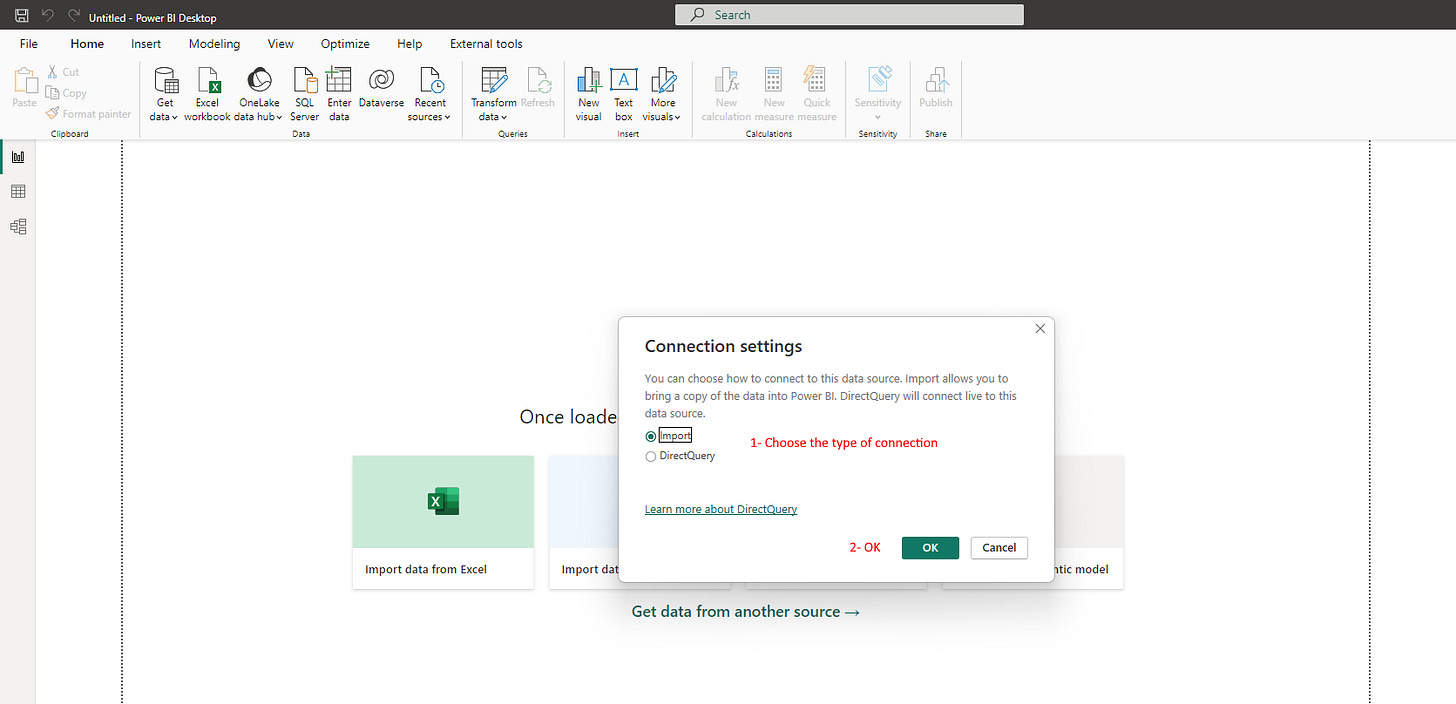
Step 6: Connection Settings
Now we need to choose the type of connection, which can be either "Import" or "Direct Query". The "Import" option allows you to bring the data into Power BI Desktop, enabling faster query performance and more extensive data modeling capabilities. However, this method may require more storage space and might not provide real-time data updates.
On the other hand, the "Direct Query" option establishes a live connection to the KQL database, allowing you to query the data directly without importing it. This method ensures real-time data access and reduces storage requirements. However, it might result in slower query performance and limited data modeling capabilities compared to the "Import" option. Carefully consider your specific needs and available resources before selecting the appropriate connection type.
We'll choose "Import" for the KQL Database due to its small size, which ensures faster query performance and more extensive data modeling capabilities without consuming significant storage space.
Step 7: Power Query Editor
Once you have clicked on the "Transform Data" button, the Power Query Editor will launch, providing you with an extensive range of tools and functionalities to refine and shape your data according to your specific requirements. This step is crucial in the data preparation process, as it allows you to clean, transform, and enrich your dataset before loading it into Power BI Desktop for analysis and visualization.
Step 8: Visualize and Share
Once you have refined and shaped your data using the Power Query Editor, you can leverage Power BI Desktop's extensive range of tools to create insightful reports and visualizations with your imported data. After perfecting your creations and ensuring they meet your requirements, you can publish these reports to the Power BI service, enabling you to share your findings with colleagues and collaborators within your organization.
Conclusion
In conclusion, Power BI Desktop and KQL databases in MS Fabric work together to help professionals manage large datasets and make data-driven decisions. Following the steps in this guide will help you use this powerful combination effectively. Remember, the true power of data analytics comes from the stories we tell with our data. This integration allows you to create compelling data stories that can lead your organization to success.


